Benchmarking Optimized Laravel vs Unoptimized Laravel
In this post, I'll share about how to benchmark your Laravel-based application and plot their result into a graph image.
In the previous post, I shared a little tips about how to optimizing your Laravel-based application. Some of my friends wonder how to benchmark / compare the result; between the optimized one and the unoptimzed one. In this post, I’ll share about how to benchmark your Laravel-based application and plot their result into a graph image.
Blackbox Benchmarking
The ApacheBench tool (ab) can load test servers by sending an arbitrary number of concurrent requests. Although ab was designed for testing Apache installations, it can be used to benchmark any HTTP server. You can get ab package in Ubuntu via:
apt-get install apache2-utils
Usage
The ApacheBench basic usage is:
ab -n <num_requests> -c <concurrency> <addr>:<port><path>
In a complex way:
ab [ -A auth-username:password ] [ -b windowsize ] [ -B local-address ] [ -c concurrency ] [ -C cookie-name=value ]
  [ -d ] [ -e csv-file ] [ -f protocol ] [ -g gnuplot-file ] [ -h ] [ -H custom-header ] [ -i ] [ -k ] [ -l ]
  [ -m HTTP-method ] [ -n requests ] [ -p POST-file ] [ -P proxy-auth-username:password ] [ -q ] [ -r ] [ -s timeout ]
  [ -S ] [ -t timelimit ] [ -T content-type ] [ -u PUT-file ] [ -v verbosity] [ -V ] [ -w ] [ -x <table>-attributes ] [ -X proxy[:port] ]
  [ -y <tr>-attributes ] [ -z <td>-attributes ] [ -Z ciphersuite ] [http[s]://]hostname[:port]/path
Case
For testing, I try to bechmark a request that returns all User lists in an application. So, the basic idea is:
- Create a resource controller via artisan command
php artisan make:controller Api/UserController --resource
- Register it with
auth:apimiddleware
<?php

/*
|--------------------------------------------------------------------------
| API Routes
|--------------------------------------------------------------------------
|
| Here is where you can register API routes for your application. These
| routes are loaded by the RouteServiceProvider within a group which
| is assigned the "api" middleware group. Enjoy building your API!
|
*/

Route::group(['middleware' => 'auth:api'], function ($route) {
    $route->resource('/resource/user', 'Api\UserController');
});
- Return all user lists for
/api/resource/userrequest on GET method
<?php

namespace App\Http\Controllers\Api;

use App\User;
use App\Http\Requests;
use Illuminate\Http\Request;
use App\Http\Controllers\Controller;

class UserController extends Controller
{
    /**
     * Display a listing of the resource.
     *
     * @return \Illuminate\Http\Response
     */
    public function index()
    {
        return User::all();
    }

    // [... OMMITED ...]
- I used Passport to authenticate every request
- In this testing, there is 101 users on my application. I stored it using a seeder and factory.
NOTE: Please note, I used Laravel 5.3 fresh package for this testing and my rigs also may different with yours, so the result may vary.
Unoptimized Configuration
Below is my unoptimized configuration:
- Using
filedriver for both session and caching - No composer autoloader optimization enabled
- No config cache enabled
- No route cache enabled
- No compiled common classes enabled
Optimized Configuration
Below is my optimized configuration:
- Using
memcacheddriver for both session and caching - Enabled composer autoloader optimization
- Enabled config caching
- Enabled route caching
- Using compiled common classes
Result
Here’s ApacheBench output for my unoptimized application:
ab -n 1000 -c 100 -H "Authorization: Bearer [PASSPORT_TOKEN]" http://laravel.ivory.dev/api/resource/user
This is ApacheBench, Version 2.3 <$Revision: 1706008 $>
Copyright 1996 Adam Twiss, Zeus Technology Ltd, http://www.zeustech.net/
Licensed to The Apache Software Foundation, http://www.apache.org/

Benchmarking laravel.ivory.dev (be patient)
Completed 100 requests
Completed 200 requests
Completed 300 requests
Completed 400 requests
Completed 500 requests
Completed 600 requests
Completed 700 requests
Completed 800 requests
Completed 900 requests
Completed 1000 requests
Finished 1000 requests


Server Software:        nginx/1.10.0
Server Hostname:        laravel.ivory.dev
Server Port:            80

Document Path:          /api/resource/user
Document Length:        14128 bytes

Concurrency Level:      100
Time taken for tests:   2.653 seconds
Complete requests:      1000
Failed requests:        937
   (Connect: 0, Receive: 0, Length: 937, Exceptions: 0)
Non-2xx responses:      937
Total transferred:      1203462 bytes
HTML transferred:       906930 bytes
Requests per second:    376.89 [#/sec] (mean)
Time per request:       265.331 [ms] (mean)
Time per request:       2.653 [ms] (mean, across all concurrent requests)
Transfer rate:          442.94 [Kbytes/sec] received

Connection Times (ms)
              min  mean[+/-sd] median   max
Connect:        0    0   0.5      0       5
Processing:    23  255  67.7    237     521
Waiting:       23  255  67.7    237     521
Total:         25  255  67.8    237     522

Percentage of the requests served within a certain time (ms)
  50%    237
  66%    247
  75%    259
  80%    265
  90%    310
  95%    448
  98%    494
  99%    507
 100%    522 (longest request)
Here’s the ApacheBench output from the optimized one:
ab -n 1000 -c 100 -H "Authorization: Bearer [PASSPORT_TOKEN]" http://laravel.ivory.dev/api/resource/user
This is ApacheBench, Version 2.3 <$Revision: 1706008 $>
Copyright 1996 Adam Twiss, Zeus Technology Ltd, http://www.zeustech.net/
Licensed to The Apache Software Foundation, http://www.apache.org/

Benchmarking laravel.ivory.dev (be patient)
Completed 100 requests
Completed 200 requests
Completed 300 requests
Completed 400 requests
Completed 500 requests
Completed 600 requests
Completed 700 requests
Completed 800 requests
Completed 900 requests
Completed 1000 requests
Finished 1000 requests


Server Software:        nginx/1.10.0
Server Hostname:        laravel.ivory.dev
Server Port:            80

Document Path:          /api/resource/user
Document Length:        18 bytes

Concurrency Level:      100
Time taken for tests:   1.690 seconds
Complete requests:      1000
Failed requests:        0
Non-2xx responses:      1000
Total transferred:      317000 bytes
HTML transferred:       18000 bytes
Requests per second:    591.83 [#/sec] (mean)
Time per request:       168.967 [ms] (mean)
Time per request:       1.690 [ms] (mean, across all concurrent requests)
Transfer rate:          183.21 [Kbytes/sec] received

Connection Times (ms)
              min  mean[+/-sd] median   max
Connect:        0    1   2.1      0       8
Processing:     7  160  27.9    167     192
Waiting:        7  160  27.9    167     192
Total:         10  161  26.4    167     192

Percentage of the requests served within a certain time (ms)
  50%    167
  66%    170
  75%    171
  80%    172
  90%    175
  95%    178
  98%    183
  99%    185
 100%    192 (longest request)
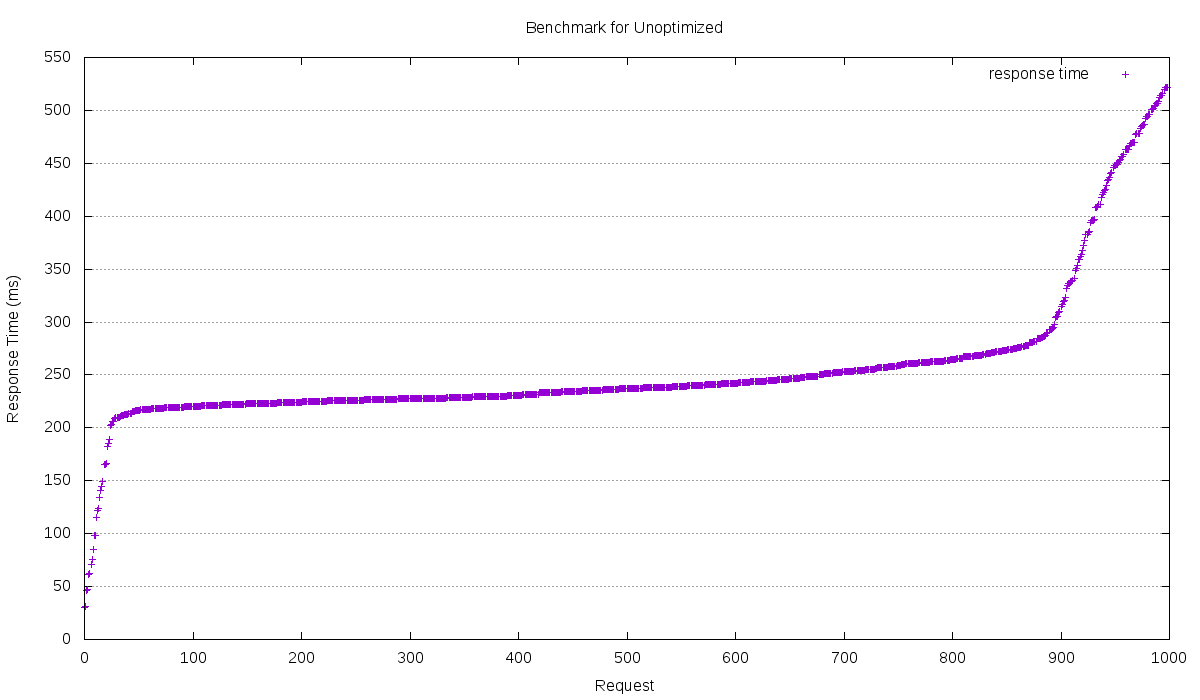
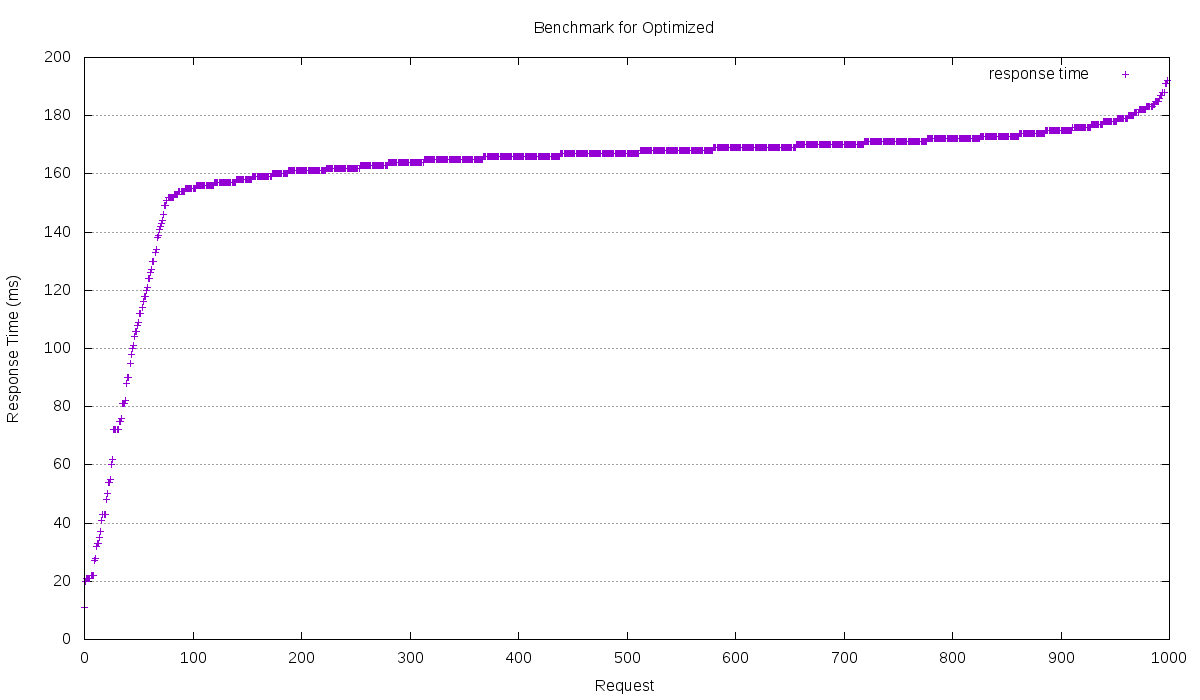
You may notice that the unoptimized one and optimized one is slightly different. But, reading this output is somehow blinding your eyes. So, to make it easier to read we can plotting it’s result to a graph.
Plotting
ApacheBench has a feature to plotting your result into a graph. To do so, you can pass -g [PLOT_FILE] arguments to your test command.
On Unoptimized application:
ab -n 1000 -c 100 -H "Authorization: Bearer [PASSPORT_TOKEN]" -g "unoptimized.tsv" http://laravel.ivory.dev/api/resource/user
After executing this command, you may found a file name unoptimized.tsv. The next step is writing a plot script.
set terminal png size 1200,700
set output "unoptimized.png"
set title "Benchmark for Unoptimized"
set grid y
set xlabel 'Request'
set ylabel 'Response Time (ms)'
set datafile separator '\t'
plot "unoptimized.tsv" every ::2 using 5 title 'response time' with points
Save to a file, eg plot.p. Next, execute:
gnuplot unoptimized.p
Notes: For ubuntu user, to install gnuplot you need to issue this command:
sudo apt install gnuplot overlay-scrollbar-gtk2
After executing this command, you’ll find your graph name (in this example it will be unoptimized.png) in the same level of your plot file.
Here’s my result for unoptimized one (lower is better):

Do the same for optimized one with this benchmark command:
ab -n 1000 -c 100 -H "Authorization: Bearer [PASSPORT_TOKEN]" -g "unoptimized.tsv" http://laravel.ivory.dev/api/resource/user
And this plot script:
set terminal png size 1200,700
set output "optimized.png"
set title "Benchmark for Optimized"
set grid y
set xlabel 'Request'
set ylabel 'Response Time (ms)'
set datafile separator '\t'
plot "optimized.tsv" every ::2 using 5 title 'response time' with points
Here’s the result for optimized one (lower is better):

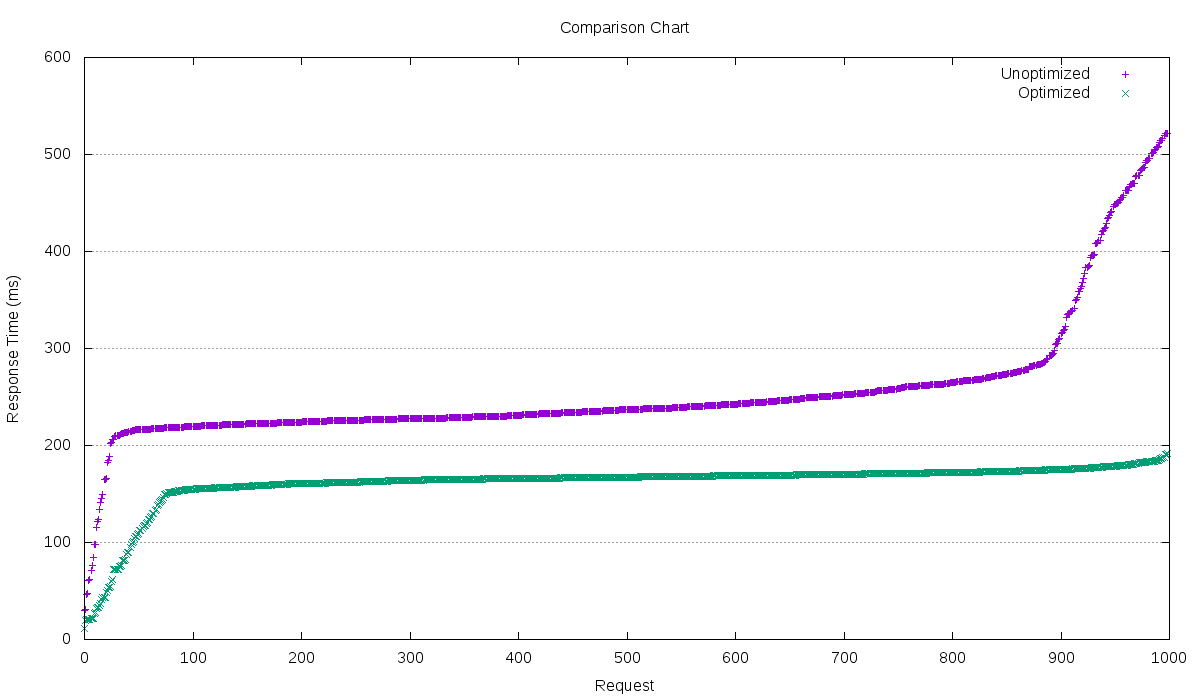
To combine this result to a single graph file, you may update your plot file:
set terminal png size 1200,700
set output "comparison.png"
set title "Comparison Chart"
set grid y
set xlabel 'Request'
set ylabel 'Response Time (ms)'
set datafile separator '\t'
plot "unoptimized.tsv" every ::2 using 5 title 'Unoptimized' with points, "optimized.tsv" every ::2 using 5 title 'Optimized' with points
Here’s the result for their comparison (lower is better):

Conclusion
Optimizing your Laravel application in a production server is important. It can make your application faster about ~150% (depends on your server specs). I’m a type of programmer who puts a high attention to my application’s performance. In my experience, optimizing your configuration is important, it can make your application slightly faster. Refactoring is a big deal, it may cause crashes here and there, but if you spare your time to optimize your code, you may learn how to write a good code and spread the love to devops. Also, you can’t always depends on your “software”, somehow you need upgrades too.
For example back then you only have 4500 unique visitors each day, but now it grows to 8 billion visitors each day. This case needs attention, refactoring and optimizing your configuration isn’t enough, your server needs upgrade or maybe the infrastructure needs architecture updates. Some of my friends even won’t use Laravel because it’s slow compared to Yii or CI. In my point of views, it depends on the case you encounter. In Laravel for example, you may not need some Middleware or providers on an entrypoint. You need to strip them out. You can’t just blame the framework if it’s slow, every framework is fast, your code is slow.