Debugging Laravel Application in Visual Studio Code
This tutorial will guide you to debug your Laravel Application in Visual Studio Code.
Ever feel that you suck a lot when debugging a bug? QA knows something wrong but Developer doesn’t know where to fix it, especially if the Developer is using PHP. If you use Laravel, you may use dd here and there, well that’s not quite good. We know that other language like Java or C# is slightly easier to debug, like (come on) we can set a breakpoint anywhere, inspecting a variable, watching expression, and do a step back or step forward. This is where Visual Studio Code comes in. With an external plugin and little adjustment to your environment, we can debugging our PHP Application (in this case, Laravel Application), say goodbye to dd!
Preparation
Before you can debug your Laravel Application, you should install php-xdebug. I won’t explain this part, you can do Google of course, or here’s good article explaining how to do so. After installing php-xdebug, change your xdebug configuration in your php.ini file.
zend_extension=xdebug.so

[XDebug]
xdebug.remote_enable = 1
xdebug.remote_autostart = 1
xdebug.remote_connect_back = 1
xdebug.remote_port = 9000
xdebug.show_local_vars = 1
You can check your xdebug configuration via phpinfo() function or simply via command line
$ php -m | grep xdebug
xdebug
$ php -i | grep xdebug
/etc/php/7.1/cli/conf.d/20-xdebug.ini,
xdebug
xdebug support => enabled
xdebug.auto_trace => Off => Off
xdebug.cli_color => 0 => 0
[... omitted ...]
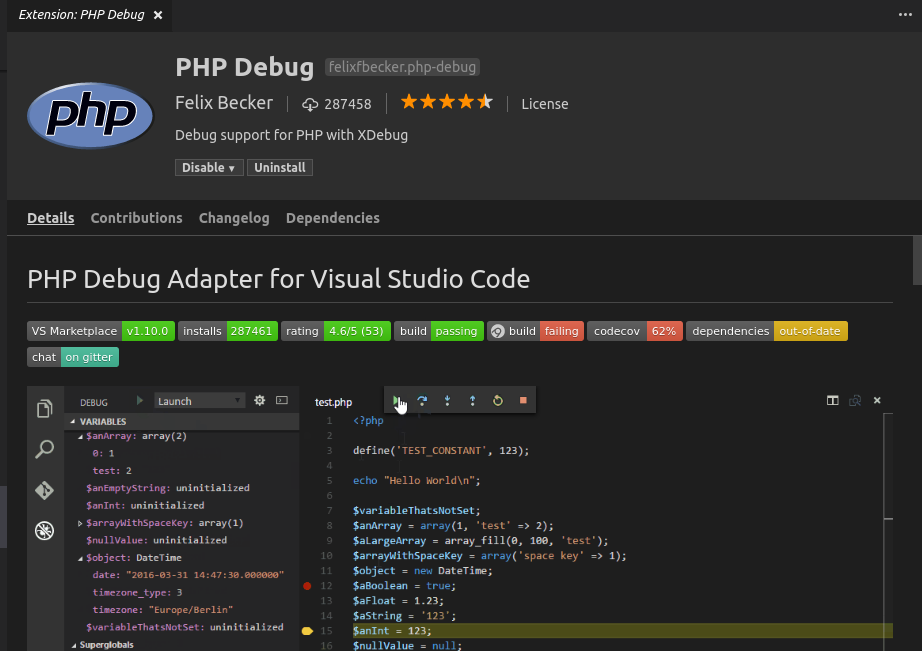
Next step is configuring your editor. Open Visual Studio Code and install felixfbecker.php-debug extension.
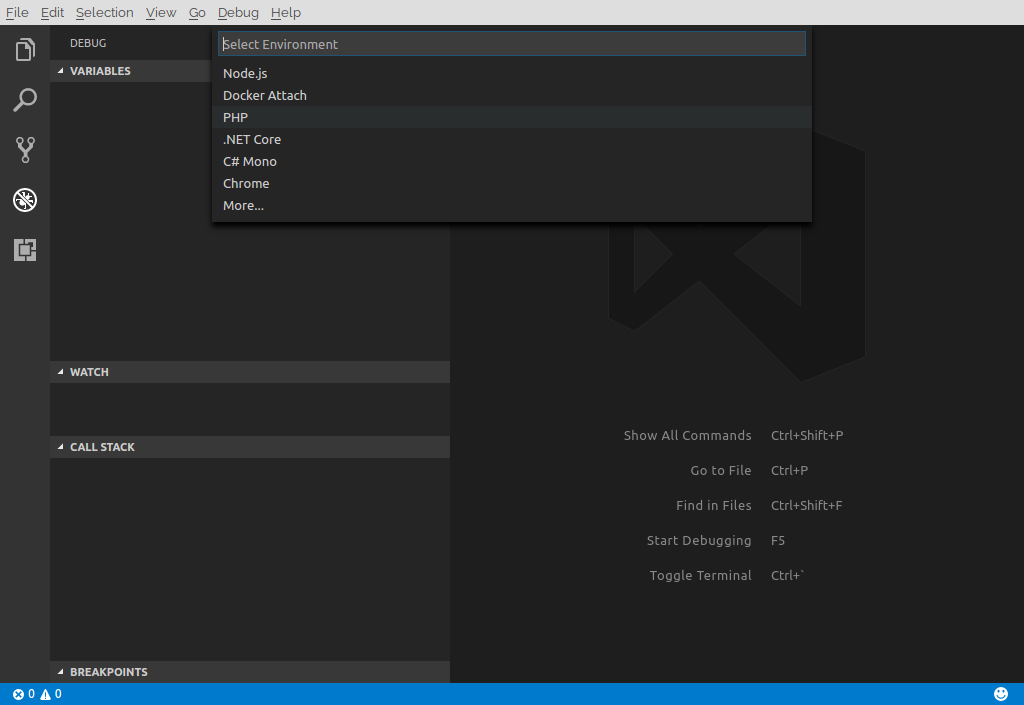
After installing the extension, you may reload your editor. After reloading, go to “Debug” tab. And click a “Gear Icon” next to “Configuration Selector”, and choose PHP.
Change your launch configuration into something like this:
{
    "version": "0.2.0",
    "configurations": [
        {
            "name": "Listen for XDebug",
            "type": "php",
            "request": "launch",
            "port": 9000
        }
    ]
}
After this step you’re ready to do some debugging.
Debugging Laravel Application
First, you need to run your application via php artisan serve command.
$ php artisan serve
Laravel development server started: <http://127.0.0.1:8000>
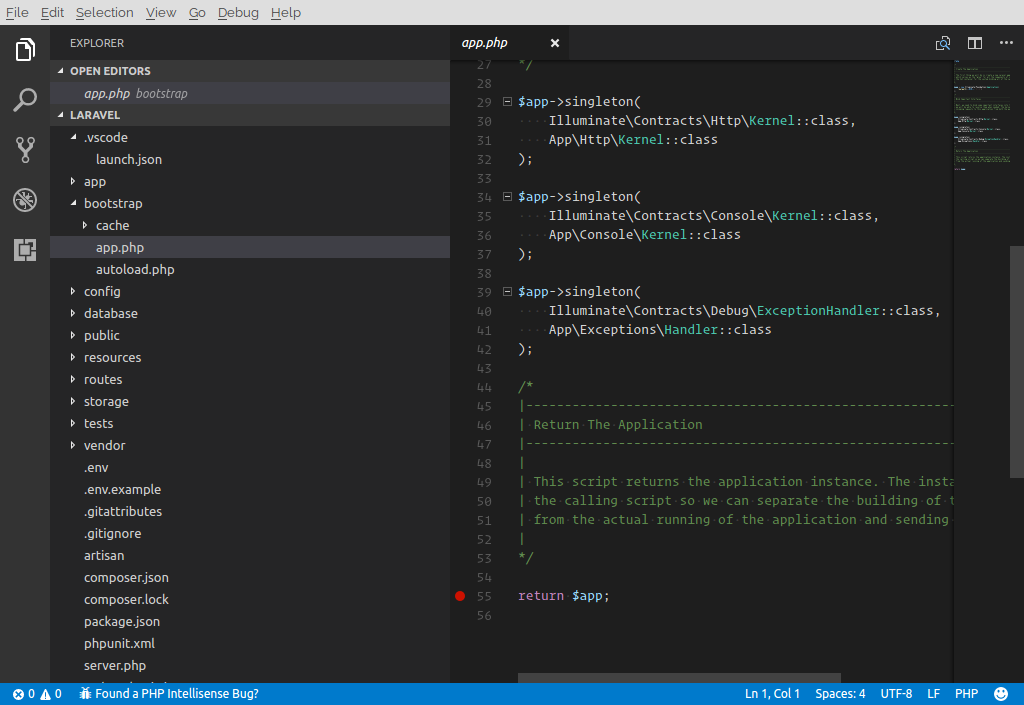
Navigate to http://127.0.0.1:8000 from your browser. From here you may see default Laravel Landing Page. Here’s the magic stuff. Set any breakpoint to your Laravel Application. For me, I set a breakpoint in bootstrap.php file.
After you set the breakpoint, go to “Debug” tab, and run “Listen for XDebug” by clicking “Green Triangle Icon”.
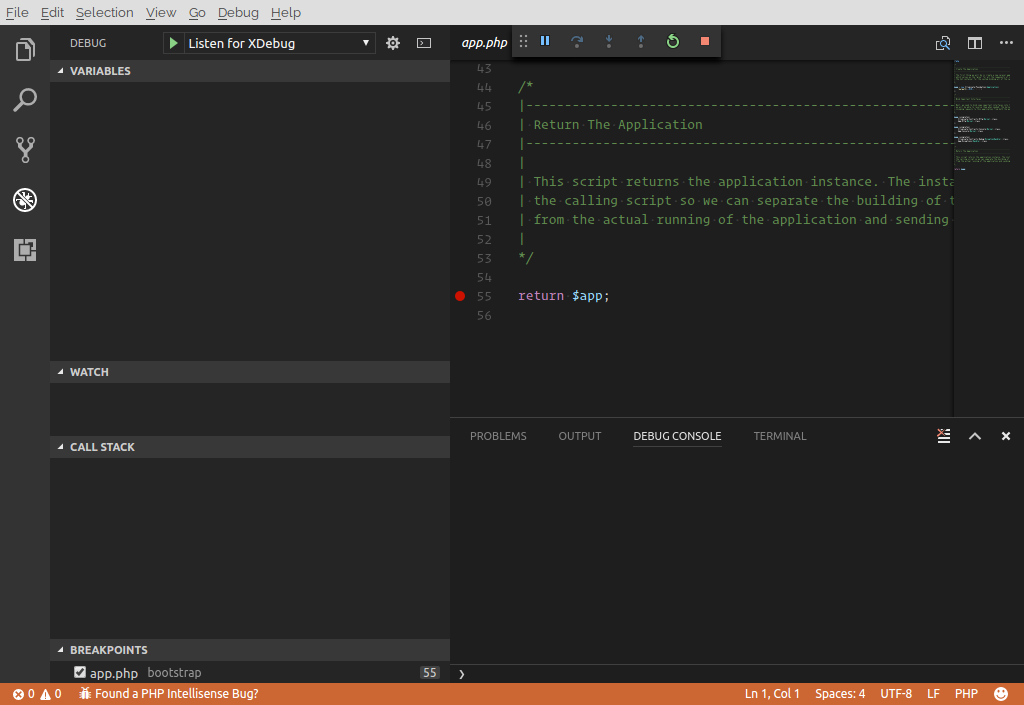
When you reload your browser, you may notice that the breakpoint is not hit. Why? It’s because we need to append XDEBUG_SESSION_START query parameter to our URI. So in your browser, instead of opening http://127.0.0.1:8000 you have to use http://127.0.0.1:8000?XDEBUG_SESSION_START=1. You may change 1 to any integer you like. This time, breakpoint should be hit.
If this article helps you in your development or bug fixing, please share this article and let me know your thoughts in comment section below. Happy code!